China Life’s 2025 attributable net profit rose 44.1%, while its comprehensive solvency ratio fell by 33.75 percentage points. In the first nine months of 2026, net profit fell 46.7%, while new business value increased 13.1%. These are not contradictions. A life insurer sells long-term promises, so investment gains, the cost of those promises and the capital needed to support them must be read together.中国人寿 2025 年归母净利润增长 44.1%,综合偿付能力充足率却下降 33.75 个百分点。2026 年前三季度,归母净利润下降 46.7%,新业务价值又增长 13.1%。这些变化并不矛盾。寿险公司出售的是长期承诺,投资赚了多少、履约要付出多少、为此需要多少资本,必须一起读。
One idea: Evaluate assets and liabilities as one economic system. Case · China Life Insurance Company Limited, 2024–2026本期知识点:把资产与负债作为一个整体,判断寿险公司的经济回报。真实案例 · 中国人寿保险股份有限公司,2024—2026 年
Keep the entity and the periods consistent先统一主体与比较期间
This case concerns the listed China Life Insurance Company Limited (601628 / 02628), not its unlisted parent China Life Insurance Group. The 2025 annual-report summary supplies both annual columns; the 2026 third-quarter report supplies both nine-month columns. Amounts are RMB millions unless marked otherwise. The information cutoff is 31 October 2026. There is no 2026 full-year result at that date, and the quarterly results are unaudited.本文研究上市的中国人寿保险股份有限公司(601628 / 02628),不是未上市的中国人寿保险集团。全年两列均取自 2025 年报摘要,前三季度两列均取自 2026 年三季报;金额除另注外均为人民币百万元。资料截至 2026 年 10 月 31 日,此时没有 2026 年全年业绩,季度数据未经审计。
| Measure指标 | 2024 | 2025 | Change变化 |
|---|---|---|---|
| Attributable net profit归母净利润 | 106,935 | 154,078 | +44.1% |
| Insurance service revenue保险服务收入 | 208,161 | 214,136 | +2.9% |
| Net investment income净投资收益 | 195,674 | 193,795 | −1.0% |
| Total investment income总投资收益 | 308,251 | 387,694 | +25.8% |
| New business value一年新业务价值 | 33,709 | 45,752 | +35.7% |
| Closing contractual service margin期末合同服务边际 | 742,488 | 768,369 | +3.5% |
| Comprehensive solvency ratio综合偿付能力充足率 | 207.76% | 174.01% | −33.75 pp |
2025 annual-report summary, printed pp. 3, 9, 17, 20–22. NBV uses the comparative column in this report, not an independently copied 2024 release.2025 年报摘要,第 3、9、17、20—22 页。新业务价值采用本报告比较列,不拼接另一份 2024 年公告的原始值。
| Measure指标 | 2025 9M | 2026 9M | Change变化 |
|---|---|---|---|
| Attributable net profit归母净利润 | 167,804 | 89,430 | −46.7% |
| Insurance service revenue保险服务收入 | 161,409 | 167,437 | +3.7% |
| Fair-value gains / losses in the income statement利润表公允价值变动损益 | 136,405 | −51,137 | −187,542 |
| Operating cash flow经营活动现金流量净额 | 399,710 | 394,990 | −1.2% |
2026 third-quarter report, pp. 6 and 11–14. Changes in the fair-value row are amounts, not growth rates. The business discussion on p. 2 reports NBV growth of 13.1% but no absolute NBV amount.2026 年三季报,第 6、11—14 页。公允价值行列示增减额,不是增长率。第 2 页披露新业务价值同比增长 13.1%,未披露对应绝对金额。
The 2026 profit decline therefore cannot, by itself, prove that new policies became less valuable. Conversely, higher NBV cannot cancel investment losses. A forecast of future new-policy economics and the current period’s reported profit answer different questions. The first task is to explain their divergence.因此,2026 年利润下降本身不能证明新卖出的保单变差;反过来,新业务价值增长也不能抵销投资损失。新保单未来盈利的估计,与本期已经计入报表的利润,回答的是不同问题。阅读财报首先要解释二者为什么不同步。
Reconcile investment income before calling it a spread先拆投资收益,再讨论利差
Total investment income in 2025 rose by 79,443. Yet net investment income fell by 1,879. The major positive change was gains on investment sales: a 4,245 loss in 2024 became a 132,951 gain in 2025, while fair-value gains decreased. Some of the year’s reported return therefore came from realizing asset price gains, rather than a uniform increase in recurring investment income.2025 年总投资收益增加 79,443,但净投资收益减少 1,879。主要的正向变化来自投资资产买卖价差:2024 年亏损 4,245,2025 年收益 132,951;同期公允价值变动收益反而下降。因此,当年的投资回报有相当部分来自兑现资产价差,不能理解成各类持续性投资收入都在增加。
How the 2025 total investment income is assembled2025 年总投资收益由哪些部分组成?
- 193,795Net investment income: interest, dividends and other specified items净投资收益:利息、股息等项目
- +132,951Gains on investment asset sales投资资产买卖价差收益
- +63,307Fair-value gains公允价值变动收益
- −131Credit impairment losses信用减值损失
- −2,228Other investment impairment losses投资资产减值损失
- =387,694Total investment income总投资收益
A realized gain is real, but selling an appreciated asset does not show that the remaining portfolio can earn the same gain again. Fair-value changes are not current cash receipts, yet they can affect economic capital and future sale proceeds. Do not label one category “all recurring” or dismiss the other as irrelevant. Ask what asset was sold, why, and at what yield the proceeds can be reinvested.已实现的价差是真实收益,但卖出上涨的资产,并不能证明余下资产还能重复赚到同样的钱。公允价值变动不是当期现金流入,却会影响经济资本和未来出售所得。不能把一类收入全部视为可持续,也不能把另一类一概视为无关紧要;要继续追问卖了什么、为什么卖,以及资金再投出去能获得多高收益。
The reported 6.09% total investment yield is not the insurer’s interest spread. It is an asset-side measure with a disclosed denominator convention. A spread analysis must also identify the corresponding liability cash flows, guarantee and participation terms, expenses and capital cost. Subtracting a product’s advertised guarantee from the portfolio’s one-year total return mixes different periods and populations.披露的 6.09% 总投资收益率不是保险公司的利差。它是资产端指标,且分母有明确计算规则。研究利差,还要找到相匹配的负债现金流、保证与分红条款、费用和资本成本。拿整个投资组合一年的总回报,直接减某款产品宣传的保证利率,会混用期间和覆盖范围。
2025 annual-report summary, pp. 17–18: investment components and yield convention; average investment assets exclude fair-value movements in other debt investments.2025 年报摘要第 17—18 页:投资收益分项及计算口径;平均投资资产分母不含其他债权投资的公允价值变动额。
Read the promise on the other side of the assets资产的另一端,是尚未履行的承诺
A policy may collect cash today and require benefits decades later. If assets mature earlier than those benefits, the insurer must reinvest at rates it does not yet know. If policyholders surrender sooner than expected, it may need liquid assets before its preferred investment exit date. Asset–liability management addresses both the timing of cash and the sensitivity of values to rates; a larger investment balance alone does not establish better matching.一张保单可能今天收到现金,几十年后才支付给付。如果资产先于给付到期,公司必须以届时未知的利率再投资;如果退保早于预期,又可能需要提前变现。资产负债管理既要处理收付时间,也要处理资产和负债价值对利率的敏感程度。投资资产规模增长,本身不能证明匹配改善。
For intuition only, suppose assets are 105, liabilities are 100 and equity is 5. With modified durations of six and ten years respectively, a one-percentage-point fall in yield gives approximate value changes of +6.3 and +10. Equity then falls by about 3.7 even though assets gain value. This first-order illustration ignores convexity, taxes and policyholder participation; the numbers are not China Life estimates. The lesson is to examine both sides of a rate shock.用一个假设说明:资产为 105、负债为 100、权益为 5,资产和负债的修正久期分别为 6 年和 10 年。收益率下降 1 个百分点,一阶估计下资产升值约 6.3,负债增加约 10,权益反而减少约 3.7。这个演算忽略凸性、税和保单分红,不代表中国人寿的实际敏感性;它说明即使资产升值,也必须同时检查负债端。
NBV estimates the present value of future shareholder profits from the year’s new business under actuarial assumptions. CSM, the contractual service margin, is an insurance-accounting balance of unearned profit released as service is provided. Their scope, assumptions and timing differ. In 2025, NBV grew 35.7%, closing CSM grew 3.5%, but CSM initially recognized on new contracts fell 8.0% to 53,074. The company attributes the latter mainly to market interest-rate changes. These measures cannot be substituted for each other or added together as current earnings.新业务价值 NBV,是按精算假设估计的当年新业务未来股东利润现值;合同服务边际 CSM,则是保险会计中尚未赚取、随服务提供而释放的利润余额。二者的范围、假设和确认时点不同。2025 年 NBV 增长 35.7%,期末 CSM 增长 3.5%,当期新合同初始确认的 CSM 却下降 8.0% 至 53,074,公司说明主要受到市场利率变化影响。不能拿一个指标替代另一个,也不能把它们加进当期利润。
2025 annual-report summary, pp. 9 and 21. The summary does not establish a common actuarial basis across insurers; examine the embedded-value assumptions before peer comparisons.2025 年报摘要第 9、21 页。摘要不意味着各公司精算假设一致;横向比较还需核对内含价值报告的假设。
Explain why solvency fell while profit rose利润增长,偿付能力充足率为何下降
The comprehensive solvency ratio divides actual regulatory capital by minimum required capital. China Life’s actual capital rose from 1,039,821 to 1,050,358 in 2025, about 1.0%. Minimum capital rose from 500,489 to 603,624, about 20.6%. The denominator grew much faster than the numerator, so the ratio fell from 207.76% to 174.01%. This is a measurable change in capital coverage, not a contradiction in the income statement.综合偿付能力充足率等于实际资本除以最低资本。2025 年,中国人寿实际资本从 1,039,821 增至 1,050,358,约增长 1.0%;最低资本从 500,489 增至 603,624,约增长 20.6%。分母远快于分子增长,比率于是从 207.76% 降至 174.01%。这是资本覆盖程度的变化,不是利润表自相矛盾。
The report identifies market-rate changes and higher equity exposure as contributors. Stocks and funds excluding money-market funds rose from 12.18% to 16.89% of investments. Seeking higher return can consume more risk capital, so owners must evaluate the added return after that capital requirement. By September 2026, comprehensive solvency was 197.56%; this is an end-date balance, not a nine-month earnings measure.报告指出,市场利率变化和权益类资产配置增加等因素影响了偿付能力。股票及基金(不含货币市场基金)占投资资产的比例由 12.18% 升至 16.89%。追求更高回报可能消耗更多风险资本,股东需要评价追加资本之后的回报。2026 年 9 月末,综合偿付能力充足率为 197.56%;它是期末存量比率,不能当作前三季度的盈利指标。
2025 annual-report summary, pp. 17 and 22: asset allocation, actual capital and minimum capital.2025 年报摘要第 17、22 页:资产配置、实际资本与最低资本。
2026 third-quarter report, p. 4: period-end solvency indicators.2026 年三季报第 4 页:期末偿付能力指标。
New business grows; long-term returns depend on asset–liability matching新业务增长,长期回报取决于资产负债匹配
China Life’s disclosures support improving new-business value and growing insurance service revenue, but sustainable shareholder returns remain unproven by either the 2025 profit surge or the 2026 profit decline. The decisive issue is whether returns on assets can meet policy promises and capital requirements across market conditions.中国人寿的披露支持新业务价值改善、保险服务收入增长,但无论 2025 年利润大增,还是 2026 年利润下降,都不能单独证明股东回报的长期水平。决定性问题是,资产回报能否在不同市场环境下覆盖保单承诺和资本要求。
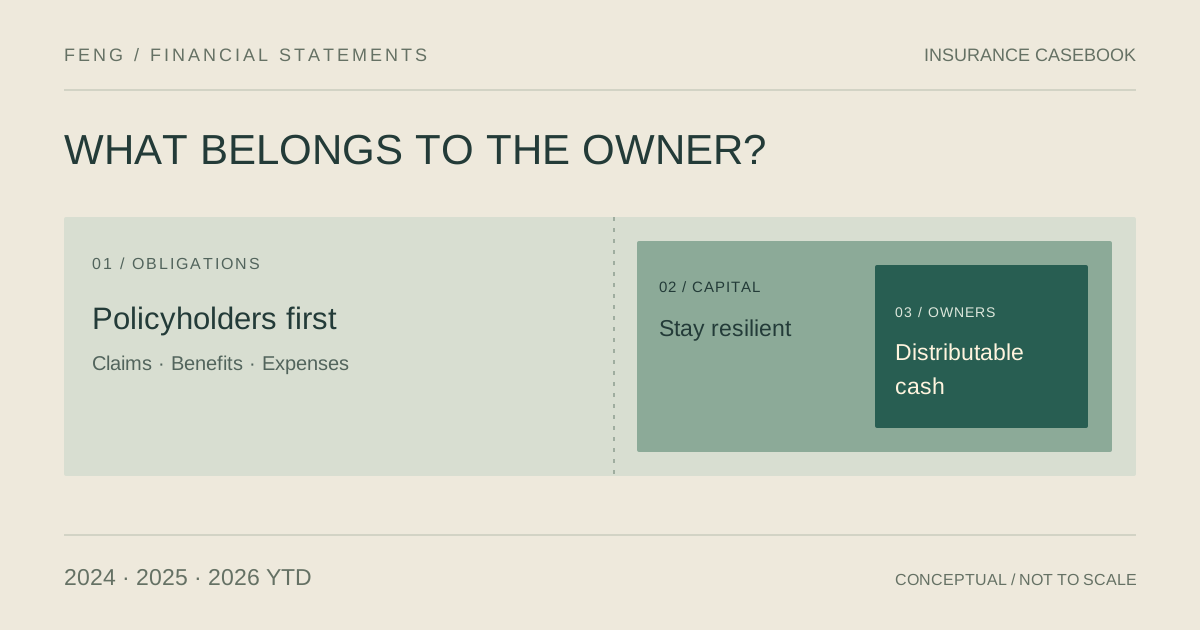
Owner economics requires both sides of the balance sheet. In 2025, total investment income rose 25.8% while net investment income fell 1.0%. That is evidence of a changed return composition, not proof that the recurring earning base rose at the headline rate. Estimate what can belong to shareholders only after allowing for claims and benefits, expenses, policyholder participation, taxes and the capital needed to support the remaining promises. Premium receipts, investment gains and the CSM balance cannot simply be added together as cash available to the owner.所有者收益,必须把资产和负债一起算。2025 年总投资收益增长 25.8%,净投资收益却下降 1.0%,这说明回报结构发生变化,不能据此认定持续性盈利基础也按同样幅度增长。估计能够归属股东的回报,要考虑赔付与给付、费用、保单利益分配、税和支持剩余承诺所需的资本。收到的保费、投资收益与 CSM 余额,不能简单相加成股东可以拿走的现金。
More return is valuable only after accounting for the extra risk capital. Actual capital increased about 1.0% in 2025 while minimum required capital increased about 20.6%, reducing comprehensive solvency from 207.76% to 174.01%. The higher return therefore came alongside a more demanding capital requirement. Reinvestment is attractive to the owner only when the expected return on the additional capital is adequate after stress, not merely when a larger equity allocation raises reported profit in a favorable market. Compare that trade-off with a lower-risk allocation or a distribution only after preserving the capital required for policyholders.多赚的收益,要扣除承担额外风险所需资本的代价。2025 年实际资本约增长 1.0%,最低资本约增长 20.6%,综合偿付能力充足率由 207.76% 降至 174.01%。更高回报同时伴随着更高的资本要求。对股东而言,再投资是否划算,要看追加资本在压力情景后的预期回报是否足够,而不能只看扩大权益配置是否在行情较好时抬高利润。比较继续投入、降低风险配置与分配给股东这些用途时,都必须先保留履行保单承诺所需的资本。
2025 annual-report summary, printed pp. 17–18 and 22: investment-income components, asset allocation and regulatory capital.2025 年报摘要第 17—18、22 页:投资收益结构、资产配置与监管资本。
Inversion focuses on a long promise funded at an uncertain future return. The favorable interpretation would fail if reinvestment yields persistently fall short of the economics assumed for existing policies, or if surrender pressure forces asset sales that weaken liquidity and capital. Incentives can compound that problem when sales targets reward present volume while the cost of guarantees emerges years later. Do not infer such a defect from the reported growth alone: verify product terms, remuneration, persistency and capital strain together. A high NBV estimate is useful only to the extent that its assumptions withstand those checks.逆向思考,要盯住长期承诺与未来收益之间的不确定性。如果再投资收益长期低于存量保单所依赖的经济假设,或者退保压力迫使公司出售资产、削弱流动性和资本,原本乐观的判断就需要推翻。激励也可能放大这一问题:销售考核若奖励当下规模,而保证责任的成本多年后才显现,就可能把风险留给未来。不能仅凭增长就认定存在这种缺陷,应把产品条款、薪酬考核、保单持续率和资本消耗一起核对。较高的 NBV 估计,只有在其假设经得住这些检验时才有说服力。
The 2026 decline needs a reconciliation, not an automatic dismissal. The fair-value line moved by −187,542 million yuan in the nine-month comparison, but that entire amount cannot be added back to attributable profit. Liability finance expenses, participation, taxes and other items also change the shareholder result. Thus, 13.1% NBV growth is evidence of better estimated new-business economics, while the 46.7% profit decline still requires an asset–liability and capital explanation. Neither metric cancels the other, and a market-related loss is not economically irrelevant merely because it is volatile.2026 年利润下降需要解释,不能直接忽略。前三季度公允价值变动损益同比减少 187,542 百万元,但不能把这个金额全部加回归母利润,保险财务费用、保单利益分配、税及其他项目也在影响股东结果。因此,NBV 增长 13.1% 支持新单经济价值估计改善,而利润下降 46.7% 仍需从资产、负债和资本的共同变动解释。一个指标不能取消另一个指标,市场损失也不会因为波动大就失去经济意义。
2026 third-quarter report, pp. 2, 6 and 11–13: NBV growth, attributable profit and the consolidated income statement.2026 年三季报第 2、6、11—13 页:NBV 增速、归母利润与合并利润表。
Actionable conclusion: A holder should maintain separate records for new-policy economics, in-force promises and stressed capital, then judge whether expected distributions survive all three. Higher NBV together with credible liability coverage and adequate capital would support the business thesis; repeated reinvestment shortfalls or capital erosion would weaken it even if new sales grew. For new research, require duration-gap and stress evidence, CSM movements and post-distribution capital before estimating normalized shareholder returns. Compare those records with New China Life, Ping An Life and CPIC Life on compatible definitions. Until that evidence supports a sustainable return range, the 2025 profit is a historical result, not a justified valuation run rate.可执行的结论:若已经持有,应分别记录新单经济性、存量保单承诺和压力下的资本,再判断预期分配能否同时经受这三项检验。NBV 改善、负债覆盖可靠、资本充足三者同时成立,才支持长期经营判断;若再投资收益持续不足或资本不断受损,即使新单增长,也应下调评价。开始新的估值研究前,应先取得久期缺口与压力测试、CSM 变动、分红后资本的证据,再估计常态化股东回报,并与新华保险、平安寿险、太保寿险按可比定义核对。在这些证据支持可持续回报区间之前,2025 年利润只是一个历史结果,不能直接当作估值时的长期盈利基准。
Exercise: isolate the capital denominator练习:分清资本与资本要求
If China Life’s 2025 actual capital stayed at 1,050,358 but minimum capital had remained at the 2024 level of 500,489, what would the ratio be? Does that counterfactual ratio justify a larger dividend?假设 2025 年实际资本仍为 1,050,358,但最低资本停留在 2024 年的 500,489,比率是多少?这个假设结果能否作为多分红的依据?
Check the reasoning核对推理
1,050,358 ÷ 500,489 ≈ 209.87%, versus the actual 174.01%. The difference isolates the denominator effect while holding actual capital fixed. It does not justify ignoring the higher required capital: the real portfolio and obligations must satisfy the actual requirement. Nor is capital above a regulatory threshold automatically cash available to shareholders.1,050,358 ÷ 500,489 ≈ 209.87%,而实际值是 174.01%。这个演算固定了实际资本,用来辨认分母变化的影响;它不能成为忽略新增资本要求的理由。真实的投资组合与保单责任必须满足真实要求,超过监管门槛的资本也不等于股东可以立即拿走的现金。
Sources and reading route资料与后续阅读
China Life 2025 annual-report summary, pp. 3–4, 9, 17–22: comparative financials, NBV, investment income, CSM and solvency.中国人寿 2025 年报摘要,第 3—4、9、17—22 页:比较报表、NBV、投资收益、CSM 与偿付能力。
China Life 2026 third-quarter report filed with HKEX, pp. 2–6 and 11–14: nine-month comparisons and period-end capital.中国人寿提交港交所的 2026 年三季报,第 2—6、11—14 页:前三季度可比数据与期末资本。
Continue with PICC’s underwriting discipline, then the five-insurer comparison.接着阅读中国人保的承保纪律,再用五家公司对照检验这些判断。