Annual profit growth turns into a year-to-date decline年度利润增长,转为前三季度同比下降
All five companies reported higher annual attributable profit in 2025 and lower nine-month profit in 2026. Yet CPIC and Ping An reported higher operating profit, PICC P&C improved underwriting profit, and China Life reported new-business value growth. The comparison must explain which part of the business changed before treating the profit movement as a change in franchise quality.五家公司 2025 年归母净利润全部增长,2026 年前三季度又全部同比下降。然而,太保和平安的营运利润仍在增长,人保财险的承保利润改善,国寿的新业务价值也在增长。读财报要先解释变化发生在哪一部分,再判断公司的经营质量是否改变。
One idea: Compare the same economic question on the same reporting basis. Cases · CPIC, New China Life, Ping An, China Life and PICC · 2024–2026本期知识点:用一致的期间与口径,比较同一个经济问题。真实案例 · 中国太保、新华保险、中国平安、中国人寿、中国人保 · 2024—2026
Fix the periods and the business boundary first先固定期间,再固定业务边界
The information cut-off is 31 October 2026. The 2024 and 2025 columns cover twelve months; 2026 covers January–September and is unaudited. Annual comparisons use the 2024 comparative figures in the 2025 annual disclosure. Quarterly comparisons use January–September 2025 figures in the 2026 third-quarter disclosure. There is no 2026 full-year estimate in this article.资料截止日为 2026 年 10 月 31 日。2024、2025 年采用全年十二个月数据;2026 年采用未经审计的前三季度数据。全年比较以 2025 年年度披露中的 2024 年比较数为准;前三季度比较以 2026 年三季报中的 2025 年同期数为准。本文不把 2026 年数据补成全年预测。
A common reporting label does not create identical businesses. CPIC combines life and P&C insurance; New China Life and listed China Life are mainly life insurers. Ping An includes banking and other financial businesses. PICC Group includes P&C, life and health; the listed group is not the separately listed PICC P&C subsidiary. Group attributable profit already accounts for minority interests, so subsidiary profits cannot simply be added to it.同叫保险公司,合并范围并不一样。太保兼有寿险与财险;新华和上市主体中国人寿以寿险为主;平安还包含银行等金融业务;人保集团包含财险、寿险和健康险,也不等于单独上市的人保财险。集团归母利润已经考虑少数股东权益,不能再把子公司利润直接加进去。
Longitudinal comparison asks what changed within one company. Cross-company comparison asks whether businesses produce different economics under comparable conditions. Use reported profit to locate a change, then compare life businesses with life businesses and P&C underwriting with P&C underwriting.纵向比较回答“一家公司自己发生了什么变化”;横向比较回答“可比条件下,几家公司的经营机制有什么差异”。先用归母利润定位变化,再把寿险与寿险、财险承保与财险承保放在一起研究。
Read the longitudinal change and the peer comparison together同一张底表,读出纵向变化与横向差异
| Listed company上市公司 | 2024 FY | 2025 FY | Change同比 |
|---|---|---|---|
| CPIC中国太保 | 449.60 | 535.05 | +19.0% |
| New China Life新华保险 | 262.29 | 362.84 | +38.3% |
| Ping An中国平安 | 1,266.07 | 1,347.78 | +6.5% |
| China Life中国人寿 | 1,069.35 | 1,540.78 | +44.1% |
| PICC Group中国人保 | 428.69 | 466.46 | +8.8% |
Sources · 来源 · CPIC中国太保 · New China Life新华保险 · Ping An中国平安 · China Life中国人寿 · PICC Group中国人保
In 2025, China Life had the largest attributable profit in this set and the fastest profit growth; New China Life followed on growth. These observations describe that year’s consolidated result. They do not measure underwriting margins, pricing power or expected shareholder returns. Ping An’s banking exposure alone prevents treating the five columns as identical insurance portfolios.2025 年,国寿在这五家中的归母利润规模最大,增速也最高,新华的增速其次。这只是对当年合并利润结果的描述,不等于承保利润率、定价能力或预期股东回报的排名。仅平安包含银行这一点,就足以说明五家公司不是同一种保险资产组合。
| Listed company上市公司 | 2025 01–09 | 2026 01–09 | Change同比 |
|---|---|---|---|
| CPIC中国太保 | 457.00 | 364.03 | −20.3% |
| New China Life新华保险 | 328.57 | 222.82 | −32.2% |
| Ping An中国平安 | 1,328.56 | 966.45 | −27.3% |
| China Life中国人寿 | 1,678.04 | 894.30 | −46.7% |
| PICC Group中国人保 | 468.22 | 318.17 | −32.0% |
Sources · 来源 · CPIC中国太保 · New China Life新华保险 · Ping An中国平安 · China Life中国人寿 · PICC Group中国人保
The order changes in 2026: Ping An has the largest nine-month attributable profit, while China Life has the deepest year-on-year decline. A profit league table therefore changes with the measurement window. The shared reversal suggests checking common market exposures, but these two tables alone cannot establish a common cause or quantify each company’s investment sensitivity.到 2026 年前三季度,利润规模最大的是平安,同比降幅最大的是国寿。单纯的利润排行榜会随观察窗口改变。共同回落提示我们排查市场敞口等共同因素,但仅凭这两张表,还不能认定每家公司下滑的原因相同,更不能测出各自的投资敏感度。
For CPIC, the valid nine-month comparison is 364.03 ÷ 457.00 − 1 = −20.3%. Dividing by full-year 2025 profit of 535.05 would compare nine months with twelve. China Life’s nine-month 2025 profit also exceeded its full-year 2025 profit: later-quarter losses can reverse earlier gains. That is another reason not to multiply nine-month results by 4/3.以太保为例,正确的前三季度同比是 364.03 ÷ 457.00 − 1 = −20.3%。若用 2025 全年的 535.05 作分母,就把九个月与十二个月混在一起。国寿 2025 年前三季度利润甚至高于当年全年利润,说明后续季度的亏损可能冲回此前收益;不能把前三季度结果机械地乘以 4/3。
Compare the operating mechanism, not just the bottom line横向比较经营机制,而不止是利润总额
New-business value, or NBV, estimates the present value of shareholder profits from newly written life business after the relevant capital costs. It is a valuation measure, not current cash. Start with growth calculated on each company’s disclosed comparable assumptions, then examine product mix, channels, persistency and investment-return assumptions. Equal amounts of NBV need not have equal sensitivity to those assumptions.新业务价值(NBV)估计新签寿险业务在相关资本成本之后,能为股东带来的未来利润现值。它是估值指标,不是本期收到的现金。先按各家公司披露的可比假设计算增长,再检查产品、渠道、持续率和投资回报假设。两个同样大的 NBV,对这些假设的敏感度也可能不同。
| Business业务 | 2024 FY | 2025 FY | 2026 01–09 |
|---|---|---|---|
| CPIC Life, incl. Hong Kong太保寿险(含香港) | 132.79 | 186.09 | −6.5%−6.5% |
| New China Life新华保险 | 62.53 | 98.42 | Positive; exact rate not disclosed¹正增长;未披露准确增幅¹ |
| Ping An Life & Health平安寿险及健康险 | 285.34 | 368.97 | −13.3%−13.3% |
| China Life中国人寿 | 337.09 | 457.52 | +13.1%+13.1% |
¹ New China Life discloses nine-month 2026 NBV of RMB 8.873 billion and positive growth, without an exact comparative value or percentage in the cited Q3 disclosure; no missing figure is inferred. CPIC’s annual life scope includes Hong Kong and restates 2024 NBV to RMB 13.279 billion. NBV amounts reflect business scale, assumptions and scope; they do not rank value-creation efficiency. NBV margins are omitted because premium denominators and product assumptions differ. PICC Group has life operations but is not included in this particular life comparison.¹ 新华披露 2026 年前三季度 NBV 为 88.73 亿元,并表述为正增长;所引三季报未提供准确的比较值或增幅,本文不反推补数。太保全年寿险口径纳入香港业务,2024 年 NBV 比较数重述为 132.79 亿元。NBV 绝对值同时受规模、假设与范围影响,不宜据此排列价值创造效率。由于保费分母与产品假设存在差异,此处也不排列 NBV 利润率。人保集团也有寿险业务,本表未将其纳入这一组寿险比较。
Sources: the CPIC, New China Life, Ping An and China Life case ledgers provide the annual-report pages, Q3 tables and assumptions behind each row. The official filings are also listed in the source register below.来源:太保、新华、平安及国寿案例列出逐项年报页码、三季报底表与假设。官方披露链接汇总在文末来源索引。
The four businesses expanded annual NBV in 2025. By the first nine months of 2026, CPIC and Ping An reported declines, while China Life and New China Life reported growth. This is a real distinction in new-business development that the all-negative profit table hides. It still needs a second test: how much comes from volume, mix, distribution cost or changed assumptions, and how much capital does it consume?这四项寿险业务的全年 NBV 在 2025 年都增长。到 2026 年前三季度,太保、平安转为下降,国寿、新华仍增长。这是净利润全部下降的表格掩盖了的真实业务差异。但还要追问:增长分别来自销量、结构、渠道费用还是假设变化,又消耗了多少资本?
| Reported scope披露范围 | 2024 FY | 2025 FY | 2025 01–09 | 2026 01–09 |
|---|---|---|---|---|
| CPIC P&C businesses太保产险板块 | 98.6 | 97.6 | 97.6 | 96.2 |
| Ping An P&C平安产险 | 98.3 | 96.8 | 97.0 | 95.6 |
| PICC P&C人保财险 | 98.5 | 97.6 | 96.1 | 95.8 |
All three reported improvements in both comparisons. Ping An has the lowest reported ratio in 2025 and nine-month 2026 within this set. That does not establish the best risk-adjusted franchise: CPIC’s row aggregates CPIC P&C, Anxin Agricultural and Hong Kong businesses; PICC’s Q3 operating row uses the P&C company’s standalone accounts. Motor/non-motor mix, catastrophe exposure, reinsurance and reserve development also differ. Sources: the annual and Q3 business reviews in the CPIC, Ping An and PICC source registers.两组同期间比较中,三家的成本率都改善。按所列披露口径,平安在 2025 全年与 2026 年前三季度的成本率最低。但这还不足以证明其风险调整后的经营质量最好:太保这一行包括太保产险、安信农险及香港业务;人保三季报的经营指标采用财险母公司单体口径。车险与非车险结构、灾害敞口、再保险和准备金发展情况也不同。来源见太保、平安及人保来源索引中的年报与三季报业务分析。
The useful conclusion is narrower and testable: all three reduced their reported combined ratios. PICC’s 2025 case then shows why the mechanism matters: its expense ratio fell by 2.2 percentage points while its claims ratio rose by 1.3 points. A lower combined ratio did not mean fewer claims. Read the decomposition before extrapolating the margin.目前能得到的结论是:三家披露的综合成本率均下降。人保 2025 年的案例进一步说明必须看原因:费用率下降 2.2 个百分点,赔付率却上升 1.3 个百分点。综合成本率下降,并不意味着赔付减少。只有拆开组成部分,才能判断利润率能否延续。
Locate the cash that can actually reach owners找到真正能够回到股东手中的钱
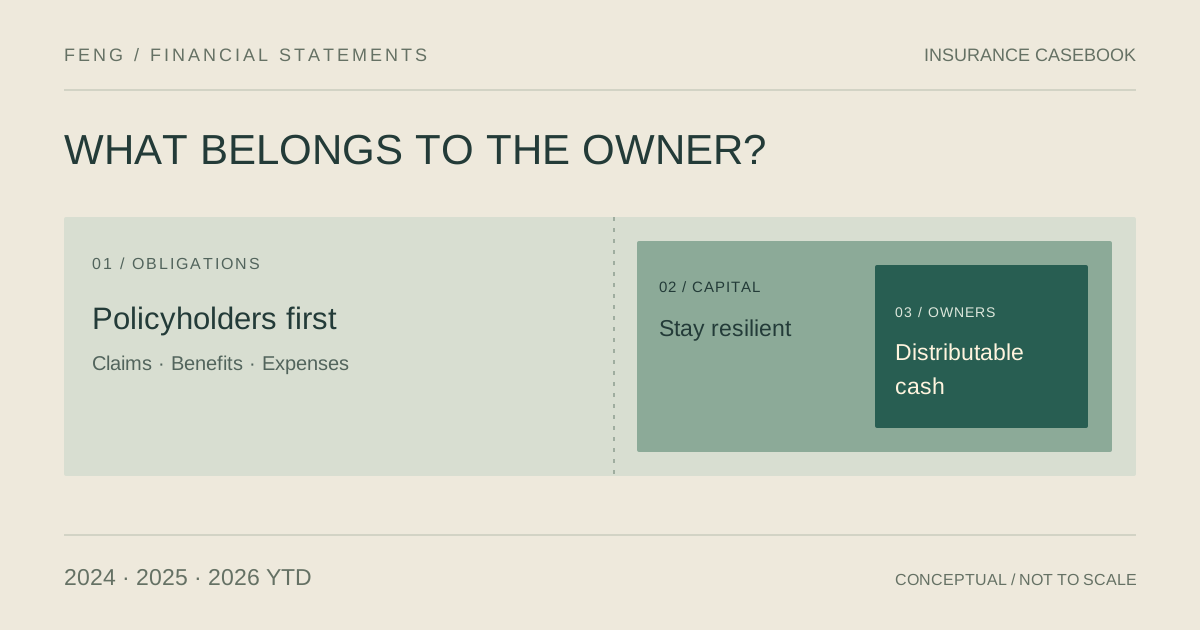
Collected premiums are not free shareholder cash收到保费,不等于股东拿到了自由现金
Honor the insurance obligations. Claims, benefits, acquisition costs and expenses absorb part of the cash.先履行保险义务。赔款、给付、获客成本与费用,都要从资金中支出。
Retain capital for risk and growth. Solvency is a constraint on distribution, not a cash balance.再保留风险与增长所需资本。偿付能力约束分红,但充足率本身不是现金余额。
Reconcile subsidiary distributions and parent-company uses before estimating sustainable shareholder cash.最后核对子公司上划分红、母公司支出及现金余额,再估计可持续的股东分配。
Insurance liabilities carry promises that survive the current reporting period. Under IFRS 17, the contractual service margin (CSM) represents unearned profit recognized as future insurance services are provided. It is not a pool of freely withdrawable cash. China’s new insurance-contract accounting uses the corresponding service-based recognition logic; the accounting basis of each filing remains the reference. IFRS Foundation: IFRS 17 principles.保险负债承载的承诺,不会随当期报表结账而消失。IFRS 17 下的合同服务边际(CSM),是随未来保险服务提供逐步确认的未赚利润,不是一池可以直接提走的现金。中国新保险合同准则采用相应的按服务确认逻辑,具体仍应以各份披露的会计口径为准。IFRS 基金会:IFRS 17 原则说明。
This changes the owner-earnings exercise from the Apple chapters. Subtracting capex from an insurer’s operating cash flow leaves policyholder obligations and capital needs unresolved. Operating profit removes specified accounting volatility using management assumptions, but is not cash either. A high solvency ratio measures capital relative to required capital; it does not say that the excess percentage can be distributed.这改变了前面 Apple 案例中所有者盈余的分析方式。保险公司的经营现金流减去资本支出后,保单义务和资本需求仍未得到处理。营运利润按管理层规定的假设剔除部分波动,也不是现金。较高的偿付能力充足率表示资本相对最低资本更充足,不表示超出的百分比都可以用于分红。
Ping An’s 2025 parent-company free-cash schedule makes the issue concrete: it received RMB 53.022 billion in subsidiary dividends, paid shareholders RMB 46.537 billion and invested RMB 19.983 billion in subsidiaries. The case reconciles the remaining items to closing parent free cash. Group profit of RMB 134.778 billion cannot replace that cash reconciliation.平安 2025 年母公司自由现金表提供了一个具体检查:子公司分红上划 530.22 亿元,向股东分红 465.37 亿元,同时对子公司投资 199.83 亿元。第十期将其他收支一并勾稽到期末母公司自由现金。集团归母利润 1,347.78 亿元,不能代替这张现金表。
Investment yields also require matching definitions. CPIC’s nine-month 2026 total investment yield is 2.5%, not annualized; New China Life’s 3.5% is annualized. Their numerical difference is not evidence of superior investment skill. Net investment yield, total investment yield and comprehensive investment yield also use different income components. Reconcile both asset and liability effects before inferring an interest spread or an economic gain.投资收益率也必须先统一定义。太保 2026 年前三季度总投资收益率 2.5% 未年化,新华的 3.5% 已年化,两者的数值差不能证明投资能力高低。净投资收益率、总投资收益率和综合投资收益率的收益构成也不同。判断利差或经济收益前,还要同时核对资产端和负债端变化。
Business conclusions and valuation conditions经营结论与估值条件
The clearest operating finding is improving P&C underwriting alongside diverging life new-business trends. All five groups reported lower attributable profit in the first nine months of 2026 than a year earlier, but that does not establish a shared deterioration in their insurance operations. Nor does a profit decline alone make a share cheap. The business comparison above separates the evidence by segment.最明确的经营结论是:财险承保在改善,寿险新业务价值的走势则出现分化。五家公司 2026 年前三季度归母利润都同比下降,但这不足以证明它们的保险业务同时恶化。利润回落本身,也不能证明股票便宜。前文的业务对比按业务范围列出证据,下面据此形成判断。
Estimate sustainable shareholder returns估计可持续股东回报
The economic attraction of insurance depends on the cost of its obligations and the returns earned against them. Premium growth creates obligations as well as investable funds. First estimate sustainable underwriting or life-policy earnings under realistic assumptions for claims, guarantees and expenses. Then reconcile necessary capital retention and cash upstreaming before estimating what can reach the listed parent and its shareholders. Do not deduct costs already included in earnings a second time, or treat the entire required-capital balance as an annual expense. The parent-cash reconciliation above makes this last step observable.保险生意的吸引力,取决于承担负债的成本以及与之匹配的资产回报。保费增长既带来可投资资金,也增加未来义务。先在合理的赔付、保证成本和费用假设下估计可持续的承保收益或寿险保单经济收益,再核对必要资本留存与现金上划,判断能有多少钱回到上市母公司及其股东。已计入收益的成本不能再次扣减,也不能把必要资本的全部余额当成每年的费用。前文的母公司现金勾稽就是最后一步的具体检验。
The entire 2025 profit uplift cannot be assumed to recur each year. Valuation should use conservative investment returns and capital needs, check actual subsidiary distributions, and express the resulting range per share. Retained earnings deserve a higher valuation only when their reinvestment can produce adequate additional value. A high dividend yield without a sustainable source of cash does not pass this test.2025 年的全部利润增量,不能一概视为每年可以重复的收益。估值应采用保守的投资回报与资本需求,结合子公司实际分红上划,形成每股可分配收益的区间。留存利润只有在再投入能够创造足够新增价值时,才值得给予相应估值。只有较高股息率,却解释不清现金来源,仍不满足这一判断条件。
Test how the investment thesis could fail检验判断的失败条件
Lower reinvestment returns can leave insufficient income to meet policy guarantees; unexpectedly large claims can reveal inadequate reserves; subsidiary capital needs can interrupt cash upstreaming. These mechanisms can occur together. An incentive tied heavily to premium volume or current profit is therefore a reason to examine pricing, persistency and reserve development. It is not evidence that any of these five companies has misstated its accounts.再投资收益降低,可能使投资收益不足以覆盖保单保证成本;赔付超出预期,可能暴露准备金不足;子公司需要补充资本,可能导致分红上划受限。这些问题还可能同时发生。因此,若考核过度依赖保费规模或当期利润,就应进一步检查定价、持续率及准备金发展。这是待检验的机制,不是在指认五家公司存在会计失实。
Five provisional business judgments五家公司的暂定经营判断
- CPIC中国太保
- Operating resilience is visible; sustained life growth is not yet established. In the first nine months of 2026, operating profit rose 5.6% and the P&C combined ratio improved, while life NBV fell 6.5%. This supports further study of recurring operating earnings. If claims deterioration erases the P&C improvement while life value keeps contracting, a thesis of resilient growth must be revised. Adjusting investment volatility out of operating profit does not eliminate its economic consequences.经营韧性有证据,寿险持续增长仍待确认。2026 年前三季度营运利润增长 5.6%、财险综合成本率改善,但寿险 NBV 下降 6.5%。这支持进一步研究其可持续经营收益。如果后续赔付恶化抵消财险改善,而寿险新增价值继续收缩,就应下调关于稳健增长的判断。营运利润剔除部分投资波动,并不会消除这些波动的经济后果。
- New China Life新华保险
- New-business growth deserves credit, with a valuation allowance for assumption risk. The 2025 sensitivity analysis reduces NBV by 32.1% when the assumed investment return falls 50 basis points. That is a conditional model result, not a forecast. The owner test is whether channel growth produces durable value after acquisition costs and capital needs. Persistency deterioration or a material value loss under more conservative assumptions would weaken the growth thesis.新业务增长值得肯定,估值必须为假设风险留出余地。2025 年敏感性分析中,投资回报假设下降 50 个基点,NBV 下降 32.1%;这是给定条件下的模型结果,不是预测。所有者真正需要的是渠道增长在扣除获客成本、考虑资本需求后仍能创造持续价值。如果保单持续率恶化,或在更保守假设下价值明显缩水,就应下调对增长质量的判断。
- Ping An中国平安
- Group growth earns no automatic diversification premium. The 2025 operating-profit improvement included a narrowing of asset-management losses, while the parent both received subsidiary dividends and reinvested in subsidiaries. Sustainable owner returns depend on recurring segment earnings and capital allocation. If weak subsidiaries repeatedly absorb the cash generated by stronger ones without adequate prospective returns, a generous group dividend or an adjusted earnings increase is insufficient to validate the investment thesis.集团增长并不自动构成多元化溢价的理由。2025 年营运利润改善包含资产管理亏损收窄,母公司一边接收子公司分红,一边对子公司投入资本。可持续股东回报取决于分部收益能否重复,以及资本配置是否有效。如果较弱业务反复消耗较强业务产生的现金,却无法给出合理的预期回报,那么较高分红或调整后利润增长,都不足以支持乐观估值。
- China Life中国人寿
- The new-business franchise is growing; stable long-term spreads need separate evidence. Nine-month 2026 NBV rose 13.1% while attributable profit fell 46.7%. Scale and sales growth do not settle whether assets can fund long-duration promises. The thesis weakens if reinvestment returns fall below obligations for a prolonged period or growth consumes capital without generating adequate risk-adjusted value. Product guarantees, asset–liability matching and capital requirements matter more here than a single year’s profit multiple.新增业务价值在增长,长期利差是否稳健还需要单独证明。2026 年前三季度 NBV 增长 13.1%,归母利润下降 46.7%。规模与销售增长,不能直接证明资产足以覆盖长期承诺。如果再投资回报长期不足以覆盖负债成本,或增长持续占用资本却不能创造相应价值,就应下调判断。产品保证成本、资产负债匹配与资本需求,比单一年度的市盈率更能解释这项风险。
- PICC Group中国人保
- Underwriting improvement is tangible, but motor profits do not establish equivalent underwriting quality in other lines. In 2025, motor underwriting profit exceeded total P&C underwriting profit; in the first nine months of 2026, P&C underwriting profit rose 11.3% despite lower group profit. Sustainable insurance economics require adequate prices and reserves across the portfolio. Persistent non-motor losses or later reserve strengthening that consumes today’s gains would weaken this judgment. Valuing the listed group also requires minority interests and its other businesses.承保改善有直接证据,车险盈利不能证明其他险种具有同样的承保质量。2025 年车险承保利润高于财险整体利润;2026 年前三季度财险承保利润增长 11.3%,集团利润却下降。保险业务能否持续创造价值,仍取决于各险种定价与准备金是否充分。如果非车险持续亏损,或后续准备金补提消耗了今天的收益,就应下调这一判断。估值中国人保集团时,还必须处理少数股东权益与其他业务。
The decision now: proceed to valuation, with explicit conditions现在的行动结论:带着条件进入估值
For the next stage, prioritize the quality of the available evidence: use P&C underwriting as a direct operating comparison; value life businesses under conservative guarantees and reinvestment assumptions; reconcile cash upstreaming and uses for conglomerates. The provisional judgments above define what must hold and what would change the conclusion. They do not establish a durable moat or a risk-adjusted ranking from two full years and a nine-month update.下一步应按证据的可验证程度推进:先用财险承保做直接的经营对照,对寿险采用保守的保证成本与再投资假设,对综合集团核对现金上划及用途。上面五条判断明确了哪些条件需要成立、什么变化会推翻结论。两份完整年报加一期前三季度更新,还不足以证明持久护城河或形成风险调整后的统一排名。
A purchase decision additionally needs a same-date A- or H-share price, the matching share-count basis, and a conservative per-share value range that incorporates capital needs and downside scenarios. Consider a purchase only if the price leaves room for estimation error and the key obligations can be understood. If the apparent bargain disappears when exceptional investment gains are normalized or guarantees are stressed, wait rather than use a low headline P/E as a substitute for the missing evidence. That is the practical output of this comparison: a research decision and its rejection conditions, with valuation still to complete.买入判断还需要同一时点的 A 股或 H 股价格、匹配的股数口径,以及纳入资本需求和不利情景的保守每股价值区间。只有关键负债能够理解,价格也为估计误差留出了余地,才进入买入讨论。如果所谓便宜在剔除不可重复的投资收益、对保证成本施压后就消失,应暂缓判断,不能用较低的表面市盈率代替缺失的证据。这次比较已经形成研究方向与否决条件,估值工作仍需继续完成。
An exercise: reject the wrong comparison, then make a useful one练习:先排除错误比较,再形成有效判断
Three claims in a draft research note研究笔记中的三句话
A draft says: “CPIC earned 535.05 亿元 in 2025 and 364.03 亿元 in 2026, so annual earnings fell 32%. Ping An’s lower combined ratio proves it is the best insurer. New China Life’s 3.5% investment yield beats CPIC’s 2.5%.” Correct all three statements, then write one defensible comparative conclusion.一份笔记写道:“太保 2025 年赚 535.05 亿元,2026 年赚 364.03 亿元,全年盈利下降约 32%;平安综合成本率更低,说明它是最好的保险公司;新华 3.5% 的投资收益率胜过太保的 2.5%。”请逐句纠正,再写出一条有依据的比较结论。
Check the reasoning核对推理
First, 364.03 covers only nine months; compare it with 457.00, giving a 20.3% decline. Second, the lower reported combined ratio applies to P&C underwriting on the stated scope, not the entire group; product mix and reserves still need investigation. Third, one yield is annualized and the other is not. A supported conclusion is: all three P&C businesses improved their own reported ratios, while life NBV trends diverged in 2026. The next research step is to explain these changes within each scope.第一,364.03 只覆盖九个月,应与同期 457.00 比较,降幅为 20.3%。第二,较低的披露成本率描述的是特定范围内的财险承保,不代表整个集团,仍需检查险种结构与准备金。第三,一个收益率已年化,另一个未年化。可以成立的结论是:三家财险业务各自的披露成本率都改善,而 2026 年寿险 NBV 的走势出现分化。下一步是在各自口径内解释这些变化。
Source register and reusable data来源索引与可复核数据
The tables use original issuer disclosures. Amounts in the downloadable data are RMB millions; displayed amounts are divided by 100 to obtain 亿元. The last two columns always represent nine months. Download the profit ledger and source metadata (JSON). Company case studies supply the additional operating metrics and their calculations.底表采用发行人原始披露。下载数据的金额单位为人民币百万元;页面显示时除以 100,换算成亿元。最后两列始终只表示九个月。下载归母利润底表与来源信息(JSON)。其他经营指标及计算过程见对应公司案例。
- CPIC: 2025 annual report, printed pp. 19–22; 2026 nine-month disclosure, 3, 5–7, 11–12.中国太保:2025 年年度报告,印刷页码 19–22;2026 年前三季度披露,3, 5–7, 11–12。
- New China Life: 2025 annual report, printed pp. 18–19, 27–29; 2026 nine-month disclosure, 1–5, 12–13.新华保险:2025 年年度报告,印刷页码 18–19, 27–29;2026 年前三季度披露,1–5, 12–13。
- Ping An: 2025 annual report, printed pp. 36–40, 79–87; 2026 nine-month disclosure, Issuer announcement, section 1.2.中国平安:2025 年年度报告,印刷页码 36–40, 79–87;2026 年前三季度披露,Issuer announcement, section 1.2。
- China Life: 2025 annual-report summary, printed pp. 3–4, 8–9, 17–22; 2026 nine-month disclosure, 6, 11–13.中国人寿:2025 年年度报告摘要,印刷页码 3–4, 8–9, 17–22;2026 年前三季度披露,6, 11–13。
- PICC Group: 2025 annual report, printed pp. 12, 23, 42; 2026 nine-month disclosure, 4–5, 9–10.中国人保:2025 年年度报告,印刷页码 12, 23, 42;2026 年前三季度披露,4–5, 9–10。
- Method: Berkshire Hathaway’s 1986 shareholder letter, owner earnings and necessary reinvestment. It motivates the analysis rather than prescribing an insurer cash-flow formula.分析方法:《伯克希尔 1986 年致股东信》中的所有者盈余与必要再投入讨论。它提供分析依据,并未规定可直接套用的保险公司现金流公式。
- Method: Charlie Munger, The Psychology of Human Misjudgment, incentives and their effects on judgment.分析方法:查理·芒格《人类误判心理学》,关于激励及其对判断的影响。